
Every control chart and capability index in the previous two guides assumed the measurement system itself was trustworthy. Gage Repeatability and Reproducibility (Gage R&R) is how that assumption gets tested instead of taken on faith: how much of the variation in the data is real part-to-part variation, and how much is noise coming from the gage and the people using it?
A measurement system with too much of its own variation can make a perfectly capable process look incapable, or worse, make an incapable process look fine. Neither the control chart nor the capability index can tell the difference on its own — that verification is MSA's job specifically.
Open the MSA / Gage R&R Studio Read the Process Capability Guide
Why MSA Matters
Protects Every Downstream Decision
Control charts, capability studies, hypothesis tests, and acceptance sampling all treat measurement data as truth. MSA is what earns that trust.
Separates Two Different Error Sources
Repeatability (the gage) and reproducibility (the people) need different fixes. Averaging them into one vague "measurement error" number hides which one to act on.
Prevents Chasing the Wrong Variation
A process investigation that's really chasing gage noise never finds a real root cause, because there isn't one to find in the process itself.
Required Before Launch on Most Customer Programs
Automotive and aerospace PPAP submissions routinely require a passing Gage R&R on critical characteristics before production approval.
Core Terms
| Term | Meaning |
|---|---|
| Repeatability (EV) | Equipment variation: the spread seen when one appraiser measures the same part repeatedly with the same gage. |
| Reproducibility (AV) | Appraiser variation: the spread seen between different appraisers measuring the same parts with the same gage. |
| GRR | Combined gage repeatability and reproducibility: the total measurement system variation, EV and AV combined. |
| PV | Part variation: the real spread between the parts being measured — the signal the gage is supposed to detect. |
| TV | Total variation: GRR and PV combined, representing everything observed in the study. |
| %Study Variation (%GRR) | GRR expressed as a percentage of total observed variation (TV) in the study. |
| %Tolerance | GRR expressed as a percentage of the specification width (USL − LSL), independent of how tight the sampled parts happened to be. |
| Number of distinct categories (ndc) | How many genuinely distinguishable part-value groups the gage can reliably separate; AIAG generally wants ndc ≥ 5. |
Study Design
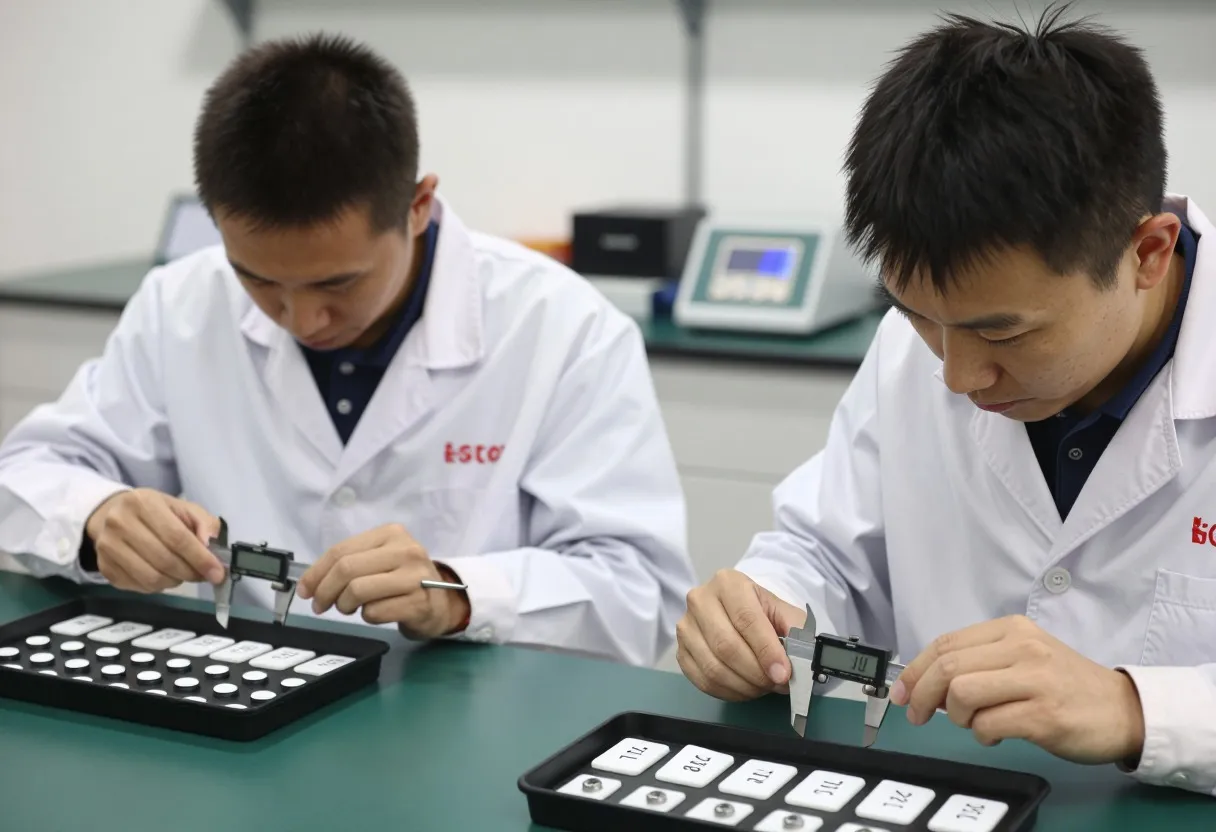
A standard Gage R&R study uses 2–3 appraisers, 10 representative parts spanning the expected range of variation, and 2–3 trials per part per appraiser, with parts presented in random order and appraisers blind to which part they are re-measuring. The worked example below uses 2 appraisers, 5 parts, and 3 trials to keep the hand arithmetic manageable — real studies should follow the full AIAG design.
- Use parts that span the process's real range, not five parts that happen to be nearly identical.
- Randomize presentation order so an appraiser can't recognize "the part I measured last."
- Keep appraisers blind to each other's readings and to their own prior readings on the same part.
- Use appraisers who normally run this measurement, not whoever happens to be free that day.
The Average-Range Method
The classic AIAG Average-Range method calculates EV, AV, PV, and GRR from simple averages and ranges, without needing statistical software. It's the method worth doing once by hand to understand the mechanics; most current software, including the MSA / Gage R&R Studio, uses the more rigorous ANOVA method covered further down.
R̄̄ is the average of all the part-by-appraiser ranges, X̄diff is the difference between appraisers' overall averages, Rp is the range of the part averages, n is the number of parts, and r is the number of trials.
| Trials (K1) | Value | Appraisers (K2) | Value |
|---|---|---|---|
| 2 | 4.56 | 2 | 3.65 |
| 3 | 3.05 | 3 | 2.70 |
| Parts | K3 | Parts | K3 |
|---|---|---|---|
| 2 | 3.65 | 7 | 1.82 |
| 3 | 2.70 | 8 | 1.74 |
| 4 | 2.30 | 9 | 1.67 |
| 5 | 2.08 | 10 | 1.62 |
| 6 | 1.93 |
Worked Example: Verifying the Gage Behind the Ridgeline Data
Before trusting the Cpk of 1.21 calculated for Ridgeline Precision Machining's bore diameter in the Process Capability worked example, the same caliper is put through a Gage R&R study: 2 appraisers, 5 parts spanning the process range, 3 trials each. The tolerance is the same ±0.030 mm on the 25.000 mm target, so USL − LSL = 0.060 mm.
- Every part-by-appraiser range comes back at a consistent 0.002 mm, so R̄̄ = 0.002 mm.
- EV = R̄̄ × K1 (3 trials, K1 = 3.05) = 0.002 × 3.05 = 0.0061 mm.
- Appraiser A averages 25.0028 mm across the 5 parts; Appraiser B averages 25.0038 mm — a consistent +0.0010 mm reading bias.
- AV = √[ (0.0010 × 3.65)² − (0.0061² / (5×3)) ] = √[0.0000133 − 0.0000025] = 0.0033 mm.
- GRR = √(0.0061² + 0.0033²) = 0.0069 mm.
- The 5 part averages range from 24.9965 mm to 25.0115 mm, so Rp = 0.0150 mm.
- PV = Rp × K3 (5 parts, K3 = 2.08) = 0.0150 × 2.08 = 0.0312 mm.
- TV = √(0.0069² + 0.0312²) = 0.0320 mm.
| Metric | Value | Verdict |
|---|---|---|
| %Study Variation (GRR/TV) | 21.7% | Acceptable, depending on application (10–30% band) |
| %Tolerance (5.15×GRR / (USL−LSL)) | 59.5% | Unacceptable (>30%) |
| ndc = 1.41 × (PV/GRR) | 6 | Acceptable (≥5) |
The same gage gets three different verdicts depending which criterion is read. %Study Variation looks acceptable because Ridgeline's parts genuinely vary more than the gage's noise. %Tolerance fails outright, because 0.0069 mm of gage noise eats nearly 60% of the entire 0.060 mm tolerance band — a real problem for a customer requirement that tight, regardless of how the current parts happen to vary. This gage should not be trusted for this tolerance without repair, replacement, or a tighter fixture, and every earlier Cpk calculated with it should be treated as provisional until that's resolved.
Why the Tool Uses ANOVA Instead
The Average-Range method above assumes appraiser differences are constant across every part. In reality, one appraiser can measure most parts consistently but struggle specifically with one awkward feature — an appraiser-by-part interaction that Average-Range cannot see at all. The ANOVA method partitions total variation into part, appraiser, appraiser×part interaction, and equipment components separately, which is both more statistically rigorous and able to flag that interaction directly. This is why the MSA / Gage R&R Studio runs ANOVA rather than Average-Range, even though the two methods usually land close together on well-behaved data.
AIAG Acceptance Criteria
| %GRR or %Tolerance | Verdict |
|---|---|
| Under 10% | Generally excellent; the measurement system is a negligible source of variation. |
| 10% to 30% | Acceptable depending on the application, the cost of improving the gage, and the importance of the characteristic. |
| Over 30% | Generally unacceptable; the measurement system needs improvement before its data can be trusted. |
| ndc under 5 | Unacceptable regardless of %GRR — the gage cannot reliably distinguish enough distinct part values. |
Some customer-specific requirements set stricter thresholds than the general AIAG guidance above, especially for safety-critical or high-cost characteristics. Always check the applicable customer or industry requirement before treating these numbers as the final word.
What to Do When MSA Fails
High Repeatability (EV)
Points at the gage itself: wear, calibration drift, poor fixturing, or a gage with insufficient resolution for the tolerance.
High Reproducibility (AV)
Points at the people or the method: inconsistent technique, unclear work instructions, or a gage that's genuinely hard to read consistently.
Low ndc Despite Low %GRR
The gage may simply lack the resolution to divide this tolerance into enough meaningful categories, independent of operator skill.
Re-Study After Any Fix
A repaired gage, a retrained operator, or a new fixture all need to be re-verified with a fresh Gage R&R, not assumed fixed.

Common Mistakes
Non-Representative Parts
Five nearly identical parts collapse PV toward zero and make %Study Variation look artificially bad, regardless of how good the gage actually is.
Not Blind
An appraiser who can see the part number or a prior reading isn't measuring independently anymore — the study result no longer means what it claims to.
Reading Only %Study Variation
A tight process can make a genuinely fine gage look bad on %Study Variation alone. Check %Tolerance and ndc too before condemning a gage.
Skipping Re-Verification
Calibration confirms accuracy against a standard. It does not confirm repeatability or reproducibility — that still needs its own study.
Quick Reference
Before the Study
- Parts span the real process range, not a narrow cluster.
- Appraisers are the people who normally run this measurement.
- Presentation order is randomized and blind.
- Gage is calibrated and appropriate for the tolerance.
Reading Results
- Check %Study Variation, %Tolerance, and ndc together, not just one.
- Separate EV from AV before deciding what to fix.
- Re-verify after any repair, retraining, or fixture change.
- Treat downstream Cpk and control-chart conclusions as provisional until MSA passes.
Sources and Further Reading
- AIAG Measurement Systems Analysis (MSA) Reference Manual, 4th Edition.
- Douglas C. Montgomery, Introduction to Statistical Quality Control.
- AIAG-VDA FMEA Handbook (for MSA requirements in PPAP contexts).
- ASQ Certified Quality Engineer Body of Knowledge.