
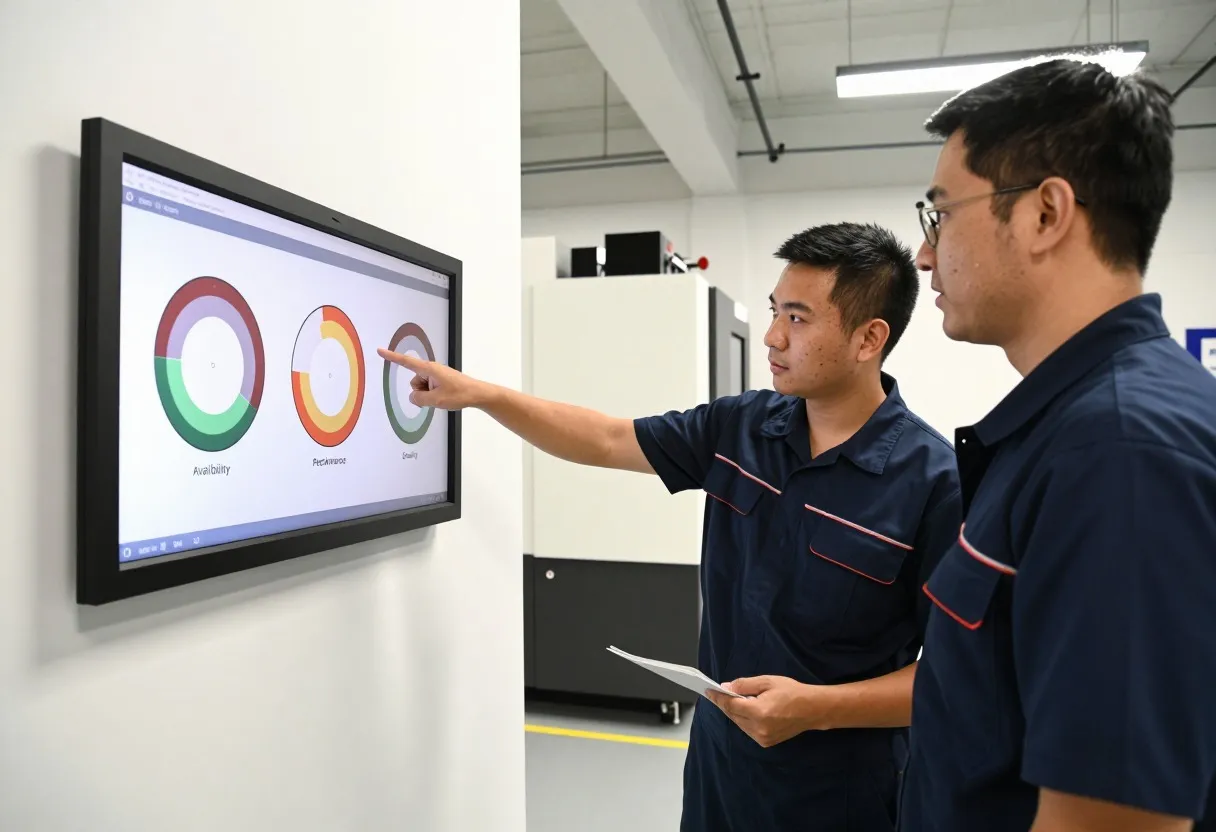
Overall Equipment Effectiveness (OEE) answers a question a simple utilization number can't: of all the time a machine was scheduled to run, how much of it actually produced good parts at the rate it's capable of? Developed by Seiichi Nakajima as part of Total Productive Maintenance (TPM), OEE multiplies three factors — Availability, Performance, and Quality — so that a single disappointing score can be traced back to a specific, actionable category of loss instead of a vague sense that "the line was slow today."
The real value of OEE isn't the percentage itself. It's the Six Big Losses framework behind it, which turns "productivity was down" into "we lost 45 minutes to breakdowns, 36 minutes to running slow, and 7 minutes to scrap" — three different problems with three different fixes.
Open the OEE Calculator and Loss Analyzer Read the SPC & Control Charts Guide
Why OEE Matters
Replaces a Vague Feeling With a Number
"The line felt slow" becomes a specific figure, broken into the loss category actually responsible.
Separates Three Different Problems
A breakdown, a slow cycle, and a scrapped part all lower OEE, but none of them get fixed the same way.
Converts Percentages Back Into Time
A 10% Availability loss on an 8-hour shift is 48 minutes of real capacity — a number that's much easier to act on than a percentage.
Prioritizes Improvement Effort
Once losses are converted into minutes, the biggest bar in the breakdown is usually the obvious place to start.
Core Terms
| Term | Meaning |
|---|---|
| Planned Production Time | Scheduled time available for production, after subtracting planned breaks, meetings, and other scheduled non-production time. |
| Downtime | Unplanned stoppages during planned production time: breakdowns, setups, and changeovers. |
| Run Time | Planned Production Time minus Downtime — the time the equipment actually ran. |
| Ideal Cycle Time | The fastest cycle time the equipment can theoretically achieve for the part being run. |
| Total Count | Every unit produced during Run Time, good and bad. |
| Good Count | Units produced that pass quality on the first pass, with no rework. |
The Six Big Losses
Nakajima grouped the causes of equipment loss into six categories, each one reducing exactly one of the three OEE factors.
| OEE factor | Loss category | Example |
|---|---|---|
| Availability | Breakdowns | Unplanned equipment failure stopping production. |
| Setup and adjustment | Changeover time between products or specifications. | |
| Performance | Minor stops | Short jams, misfeeds, or sensor faults, each too brief to log as a breakdown. |
| Reduced speed | Running below the ideal cycle time due to wear, operator pacing, or caution. | |
| Quality | Startup rejects | Scrap produced during warmup or immediately after a changeover. |
| Production rejects | Scrap produced during otherwise normal, steady-state running. |
The Formula
The OEE Calculator and Loss Analyzer runs these four formulas directly from the six inputs above and breaks the result down by loss category, so the hand calculation below is worth doing once to see exactly where each factor comes from.
World-Class Benchmarks
| OEE | Interpretation |
|---|---|
| 85% (90% × 95% × 99%) | Widely cited world-class benchmark for discrete manufacturing. |
| ~60% | Typical for manufacturers without a formal TPM or loss-tracking program. |
| Below 40% | Usually signals significant, addressable loss and is common on a first measurement. |
Worked Example: An 8-Hour Shift at Ridgeline
Ridgeline Precision Machining tracks OEE for the same CNC cell used in the SPC and Process Capability guides. The shift is scheduled for 480 minutes, with 30 minutes of paid break subtracted, giving 450 minutes of Planned Production Time.
- During the shift, one 25-minute unplanned spindle fault and one 20-minute changeover occur, for 45 minutes of Downtime.
- Run Time = 450 − 45 = 405 minutes.
- Availability = 405 / 450 = 90.0%.
- The Ideal Cycle Time for this part is 0.90 minutes, and Total Count for the shift is 410 parts.
- Performance = (0.90 × 410) / 405 = 369 / 405 = 91.1%.
- Of the 410 parts, 8 are scrapped — the same tool-wear-related defects investigated in the SPC guide's worked example — leaving Good Count = 402.
- Quality = 402 / 410 = 98.0%.
- OEE = 0.900 × 0.911 × 0.980 = 80.4%.
80.4% is a solid score, short of the 85% world-class benchmark but well above the roughly 60% typical of a plant without a formal loss-tracking program. Converting each factor's loss back into minutes shows exactly where the remaining gap lives.
Read as minutes instead of percentages, Availability's 45-minute loss is bigger than Performance's 36 minutes and dwarfs Quality's 7.2 minutes. For this shift, the highest-leverage fix isn't a quality investigation — it's reducing the 20-minute changeover or preventing the spindle fault, since either one recovers more time than eliminating the scrap entirely.
What to Do With a Low OEE
Convert Percentages to Minutes First
The biggest bar in the time breakdown, not the lowest percentage, usually points to the best place to start.
Low Availability: Attack Changeover and Breakdowns
Quick-changeover methods and preventive maintenance address the two most common Availability losses directly.
Low Performance: Watch for Minor Stops
Small, frequent stops rarely get logged individually but often add up to more lost time than the rare big breakdown.
Low Quality: Check the Measurement System First
Before chasing a scrap problem, confirm the gage calling it scrap is itself trustworthy — see the MSA & Gage R&R Guide.
Common Mistakes
Comparing OEE Across Dissimilar Machines
OEE is most meaningful as a trend on the same equipment over time, not a leaderboard across different machines and products.
Gaming the Ideal Cycle Time
Setting an artificially slow "ideal" cycle time inflates Performance and defeats the entire point of the metric.
Ignoring Minor Stops
Stops under a few minutes rarely get logged, but they're frequently the largest unaccounted-for Performance loss.
Using OEE as a Punitive Metric
An OEE tied to blame gets gamed and under-reported. Used as a loss-finding tool instead, it gets reported honestly.
Quick Reference
Setup Checklist
- Planned Production Time excludes only genuinely scheduled non-production time.
- Ideal Cycle Time reflects the equipment's real theoretical best, not a padded estimate.
- Minor stops have a defined, consistently applied logging threshold.
- Good Count reflects first-pass quality, not counts after rework.
Using the Result
- Convert each factor's loss into minutes before prioritizing action.
- Track OEE as a trend on the same equipment, not a cross-machine ranking.
- Treat a low quality factor as a cue to check the measurement system too.
- Re-measure after any change to confirm the fix actually moved the number.
Sources and Further Reading
- Seiichi Nakajima, Introduction to TPM: Total Productive Maintenance.
- Robert Hansen, Overall Equipment Effectiveness: A Powerful Production/Maintenance Tool for Increased Profits.
- SEMI E10 Standard for equipment reliability, availability, and maintainability metrics.
- ASQ Certified Quality Engineer Body of Knowledge.